Final Report
Introduction & Objective
From Chocolate City to Cappuccino City – Washington D.C.’s Black population has seen the highs and lows. D.C.’s beginnings were full of Black pride and culture. From go-go music to Howard University, to U St – or what was once known as Black Broadway. The list goes on, even to the ones who once lived here, such as Duke Ellington and Langston Hughes. D.C.’s Black community managed to maintain its pinnacle for decades. But this raises the question: what happened? Do we blame the war on drugs? Or gentrification? There are many things to blame, but the reality is that blaming will not fix the problem. What we can do is address it and do all that we can to rectify the issue. Money equals resources, and resources equals success. One would think the public schools would be level playing fields. However, for D.C., the quality of your education depends on your ward of residence. D.C.’s most affluent wards are Wards 2 and 3, and on the opposite side of the scale are Wards 7 and 8. Each ward consists of many neighborhoods, totaling about 130 across all 8. With gentrification, Wards 5, 7, and 8 experienced the highest rates of housing displacement.
The problems this city faces are systemic – when it comes to the school-to-prison pipeline, a system that pushes students, particularly those at risk, out of schools and into the criminal justice system, black students are the leading group experiencing in-school arrests (Marinelli 2021). Analyzing the educational disparities and the impacts of the socioeconomic factors will allow us to begin to address the issue. This report aims to explore how socioeconomic conditions, ward demographics, and the allocation of resources impact student success in D.C. public schools - with a particular focus on the stark contrasts between Wards 2 and 3 and Wards 7 and 8. Through this analysis, we hope to uncover actionable insights to promote equitable opportunities for all students.
Methodologies
I analyzed data on ten socioeconomic features of 29 high schools in the Washington D.C. area. Each school was mapped to its corresponding ward so that I could observe intra-ward and inter-ward relationships. Visualization tools such as scatter plots and correlation maps helped to identify the more evident trends and relationships between the different features. Additionally, clustering techniques were used to uncover hidden trends. Linear Regression and Decision Trees served as the supervised modeling techniques, in which I trained the model to analyze what features are most predictive of our student success indicators. All analyses were conducted in Python using various libraries. This approach provided valuable insights into disparities across schools and wards.
Key Findings
How Does Attendance Impact Graduation Rates Across Wards?
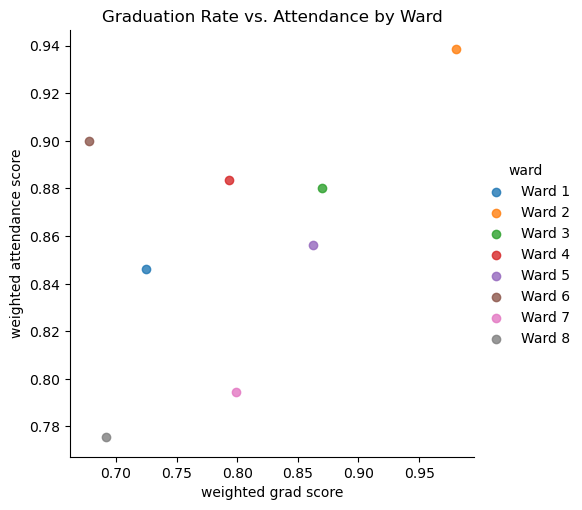
Graduation rates are closely linked to attendance scores. Ward with higher attendance also report high graduation rates.
We must put money into the wards that have been neglected if we are going to eliminate the disparities in education that exist between our neighborhoods.
What is the Relationship Between Socioeconomic Status (Median Household Income) and Graduation Rates?
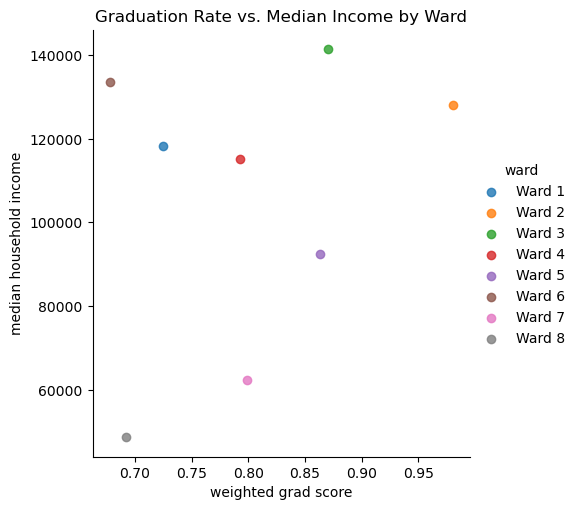
Among lower wards with median household incomes, the graduation rates are also lower. That is particularly true in Ward 8 and Ward 7, which are our two lowest wards in terms of median household income (any all other indicators as well).
Income inequality creates unequal educational opportunities, which directly impact graduation rates. Efforts to increase equitable funding, resources, and community support in lower-income wards could improve these metrics
How Does Household Income Influence Access to Advanced Programs Like AP/IB Across Wards?
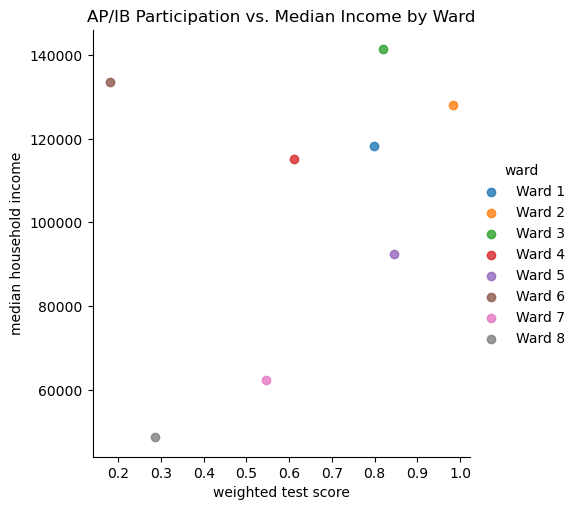
The wards with a higher median household income tend to have a high participation rate in AP and IB courses, as evidenced by the clear upward trend. For instance, Ward 2 and Ward 3 have the highest median income scores and the highest participation rates in these advanced courses.
There is an obvious disparity in access to these advanced educational opportunities. Schools in lower-income wards do not have the resources to offer the kinds of classes that would adequately prepare and challenge students for college-level work.
What Disparities Exist Between Wards Regarding School Performance and Socioeconomic Indicators?
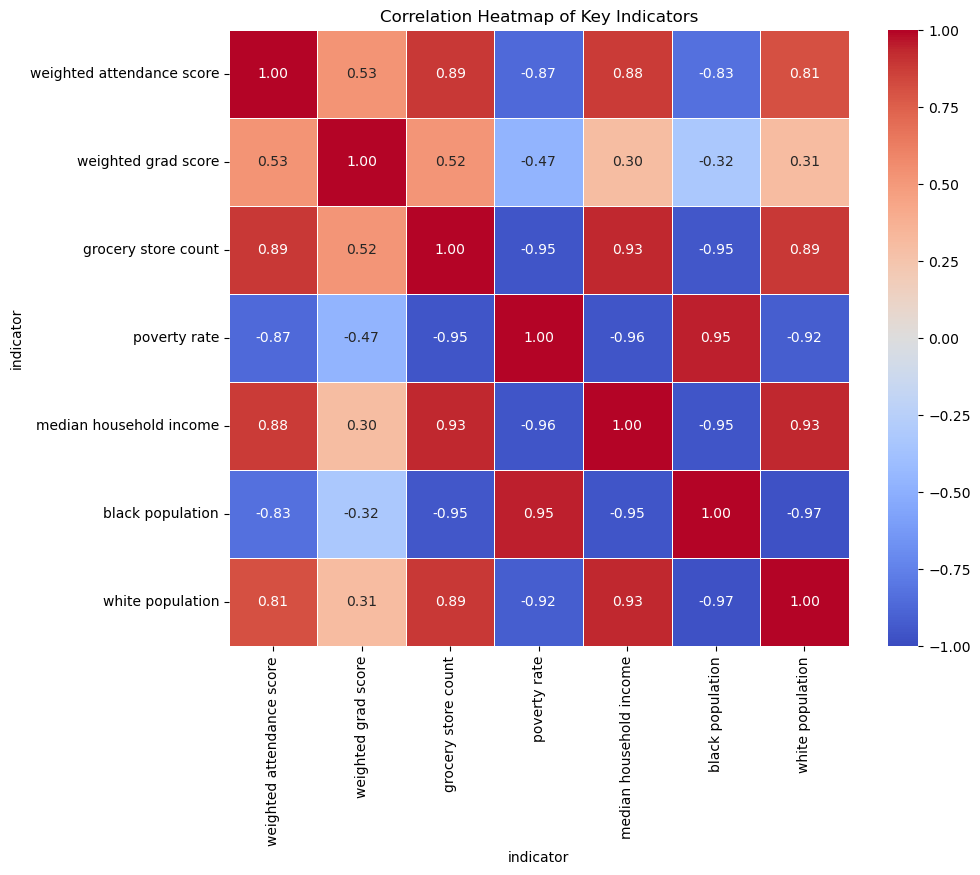
The poverty rate and other indicators show clear and strong negative correlations with possible indicators of school success. Attendance drops as poverty climbs. And on this path towards poverty, the access to resources like healthcare diminishes.
These indicators tell us about the direct and significant relationship that pulls academic performance down as poverty pulls attendance down. There is a clear direct correlation.
What Are the Most Significant Predictors of Student Success Rates in DC Public Schools?
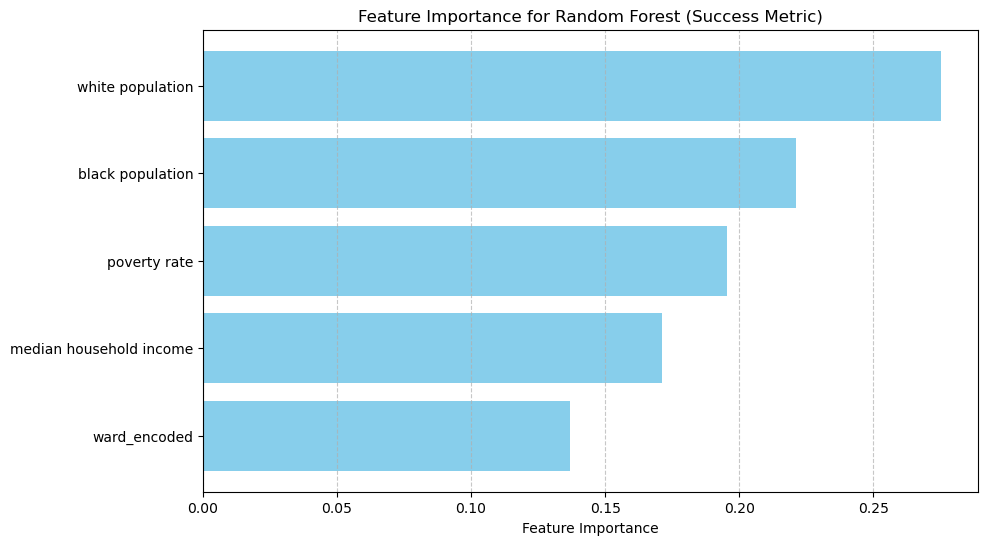
The most important predictors of overall student success turned out to be race and poverty. After those two, median household income appeared to be a significant factor.
While the data setset did not provide the algorithm with a substantial amount of point to train and test on, the model does give us some clues as to which features might be making the biggest impact.
Conclusion
Societal Implications
This analysis explored the relationship between socioeconomic indicators and student success in D.C. schools by measuring through various features and composite metrics of graduation rates, attendance scores, and test participation. Machine learning techniques like Random Forest classification allowed the study to reveal that demographic factors, particularly the proportion of White and Black populations, poverty rates, and median household income, play a significant role in predicting school performance tiers.
The findings emphasize a troubling reality: socioeconomic disparities strongly correlate with educational outcomes, therefore perpetuating systemic inequities. The data showed us that schools in communities with higher poverty rates and lower median incomes struggle with performing well in school - reinforcing the need to address broader societal issues such as economic inequality, housing instability, and access to quality education and resources. Unfortunately, data limitations affected my analyses tremendously - expanding the dataset beyond the scope of D.C. could help build a more robust model as it would provide more data to train, validate, and test an algorithm on.
Call to Action
The systemic challenges faced by urban communities across the United States must be faced head-on. Cooperation from policymakers, educators, and community leaders is essential to provide underserved communities with the tools necessary to prosper. It is up to all of us. Uplifting these schools requires collective effort: investing in educational resources, advocating for equitable funding, and supporting programs that close the gaps between struggling and high-performing schools. Consider what’s possible when schools, local governments, and businesses join forces. Picture mentorship programs that connect students with professionals, internships that provide real-world experience, and community initiatives that build pathways to success. These efforts change lives, but they start small—with us. Whether you volunteer as a reading tutor, a math coach, or at a local food pantry, your involvement matters. The youth in these communities need support - and they need it now. What role will you play? How will you show up to create change?
This is just the beginning. Expanding this analysis and integrating new data sources will allow us to uncover even more powerful insights - insights that can guide decisions and spark real change. But numbers alone won’t build the future we envision. It is time to reimagine education to be a system that is fair, inclusive, and transformative, no matter where a child lives or learns. This is the moment to take that first step as we build a future where every student thrives - regardless of area code - because they deserve nothing less.